Case study — Data analytics / Business intelligence / Supply chain
Inventory Intelligence — Power BI Supply Chain Analytics Dashboard
A four-page Power BI reporting solution for Northstar Manufacturing Ltd., a fictional manufacturing company, built on synthetic inventory, purchasing, supplier and warehouse data. The dashboard demonstrates inventory performance analysis, ABC classification, replenishment control, supplier risk monitoring and material-level drill-through.
Screenshots of each dashboard page can be downloaded in the gallery below. This is a portfolio demonstration using synthetic data. Northstar Manufacturing Ltd. is a fictional company.
Key portfolio metrics
What the dashboard reveals.
500
Materials analysed
NZ$2.72M
Inventory value
79
Materials below reorder point
21
Stockout materials
NZ$10.68M
Annual consumption value
3.93x
Inventory turnover
332
Overdue purchase-order lines
These metrics are results from synthetic data, not real-world business improvements.
Dashboard pages
Four connected report pages.
Behind the build
From transactional data to decisions.
Business Challenge
Northstar Manufacturing Ltd. faced a working-capital and availability balancing problem: how can inventory teams maintain material availability without tying up unnecessary cash in excess stock? The team needed inventory visibility across categories, materials and warehouses; control of exceptions such as stockouts, reorder gaps and excess inventory; insight into supplier exposure through open and overdue orders; and a way to investigate individual materials down to receipts, issues and purchase-order records.
Data Preparation
The solution is built on a synthetic 2025 dataset covering 500 materials across 3 warehouses, with monthly stock snapshots, inventory movements and purchasing records. In Power Query, data types, keys and dates were standardised and source data validated before modelling.
Analytical Approach
A star-schema data model was built with dimension and fact tables and controlled one-to-many relationships. DAX measures calculate inventory value, stockouts, reorder shortfall, annual consumption, turnover and overdue purchase orders. ABC classification segments materials by consumption contribution to focus attention where it matters most.
Dashboard Features
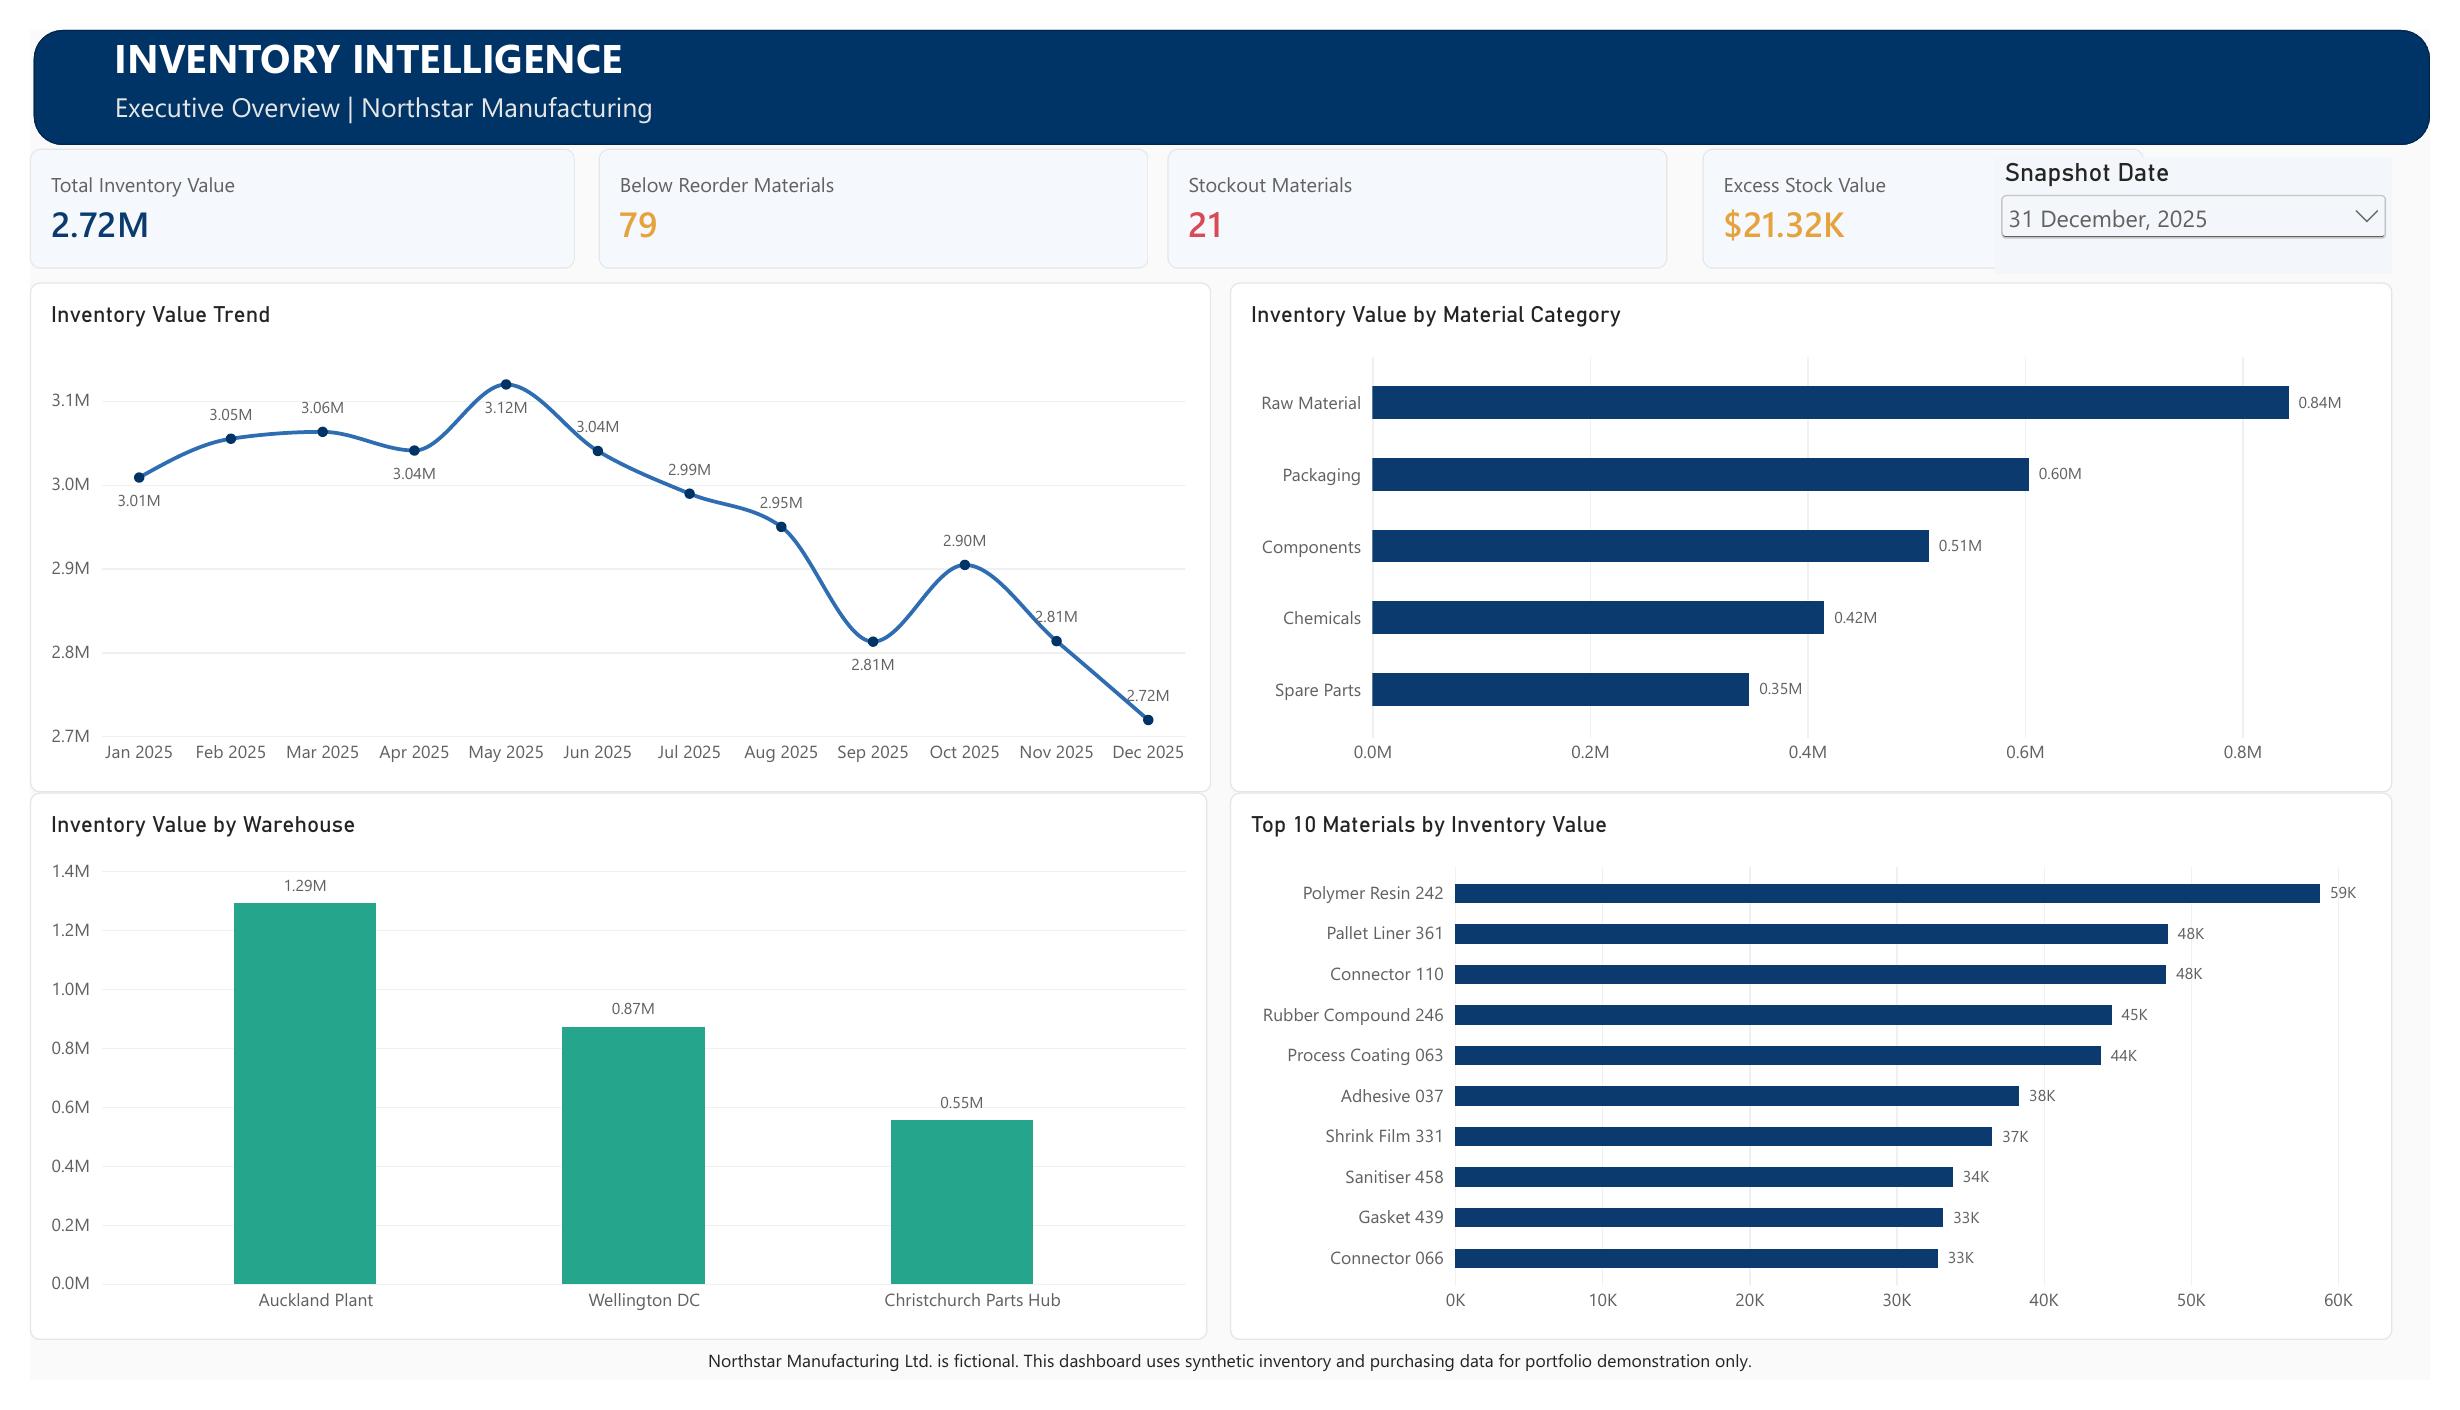
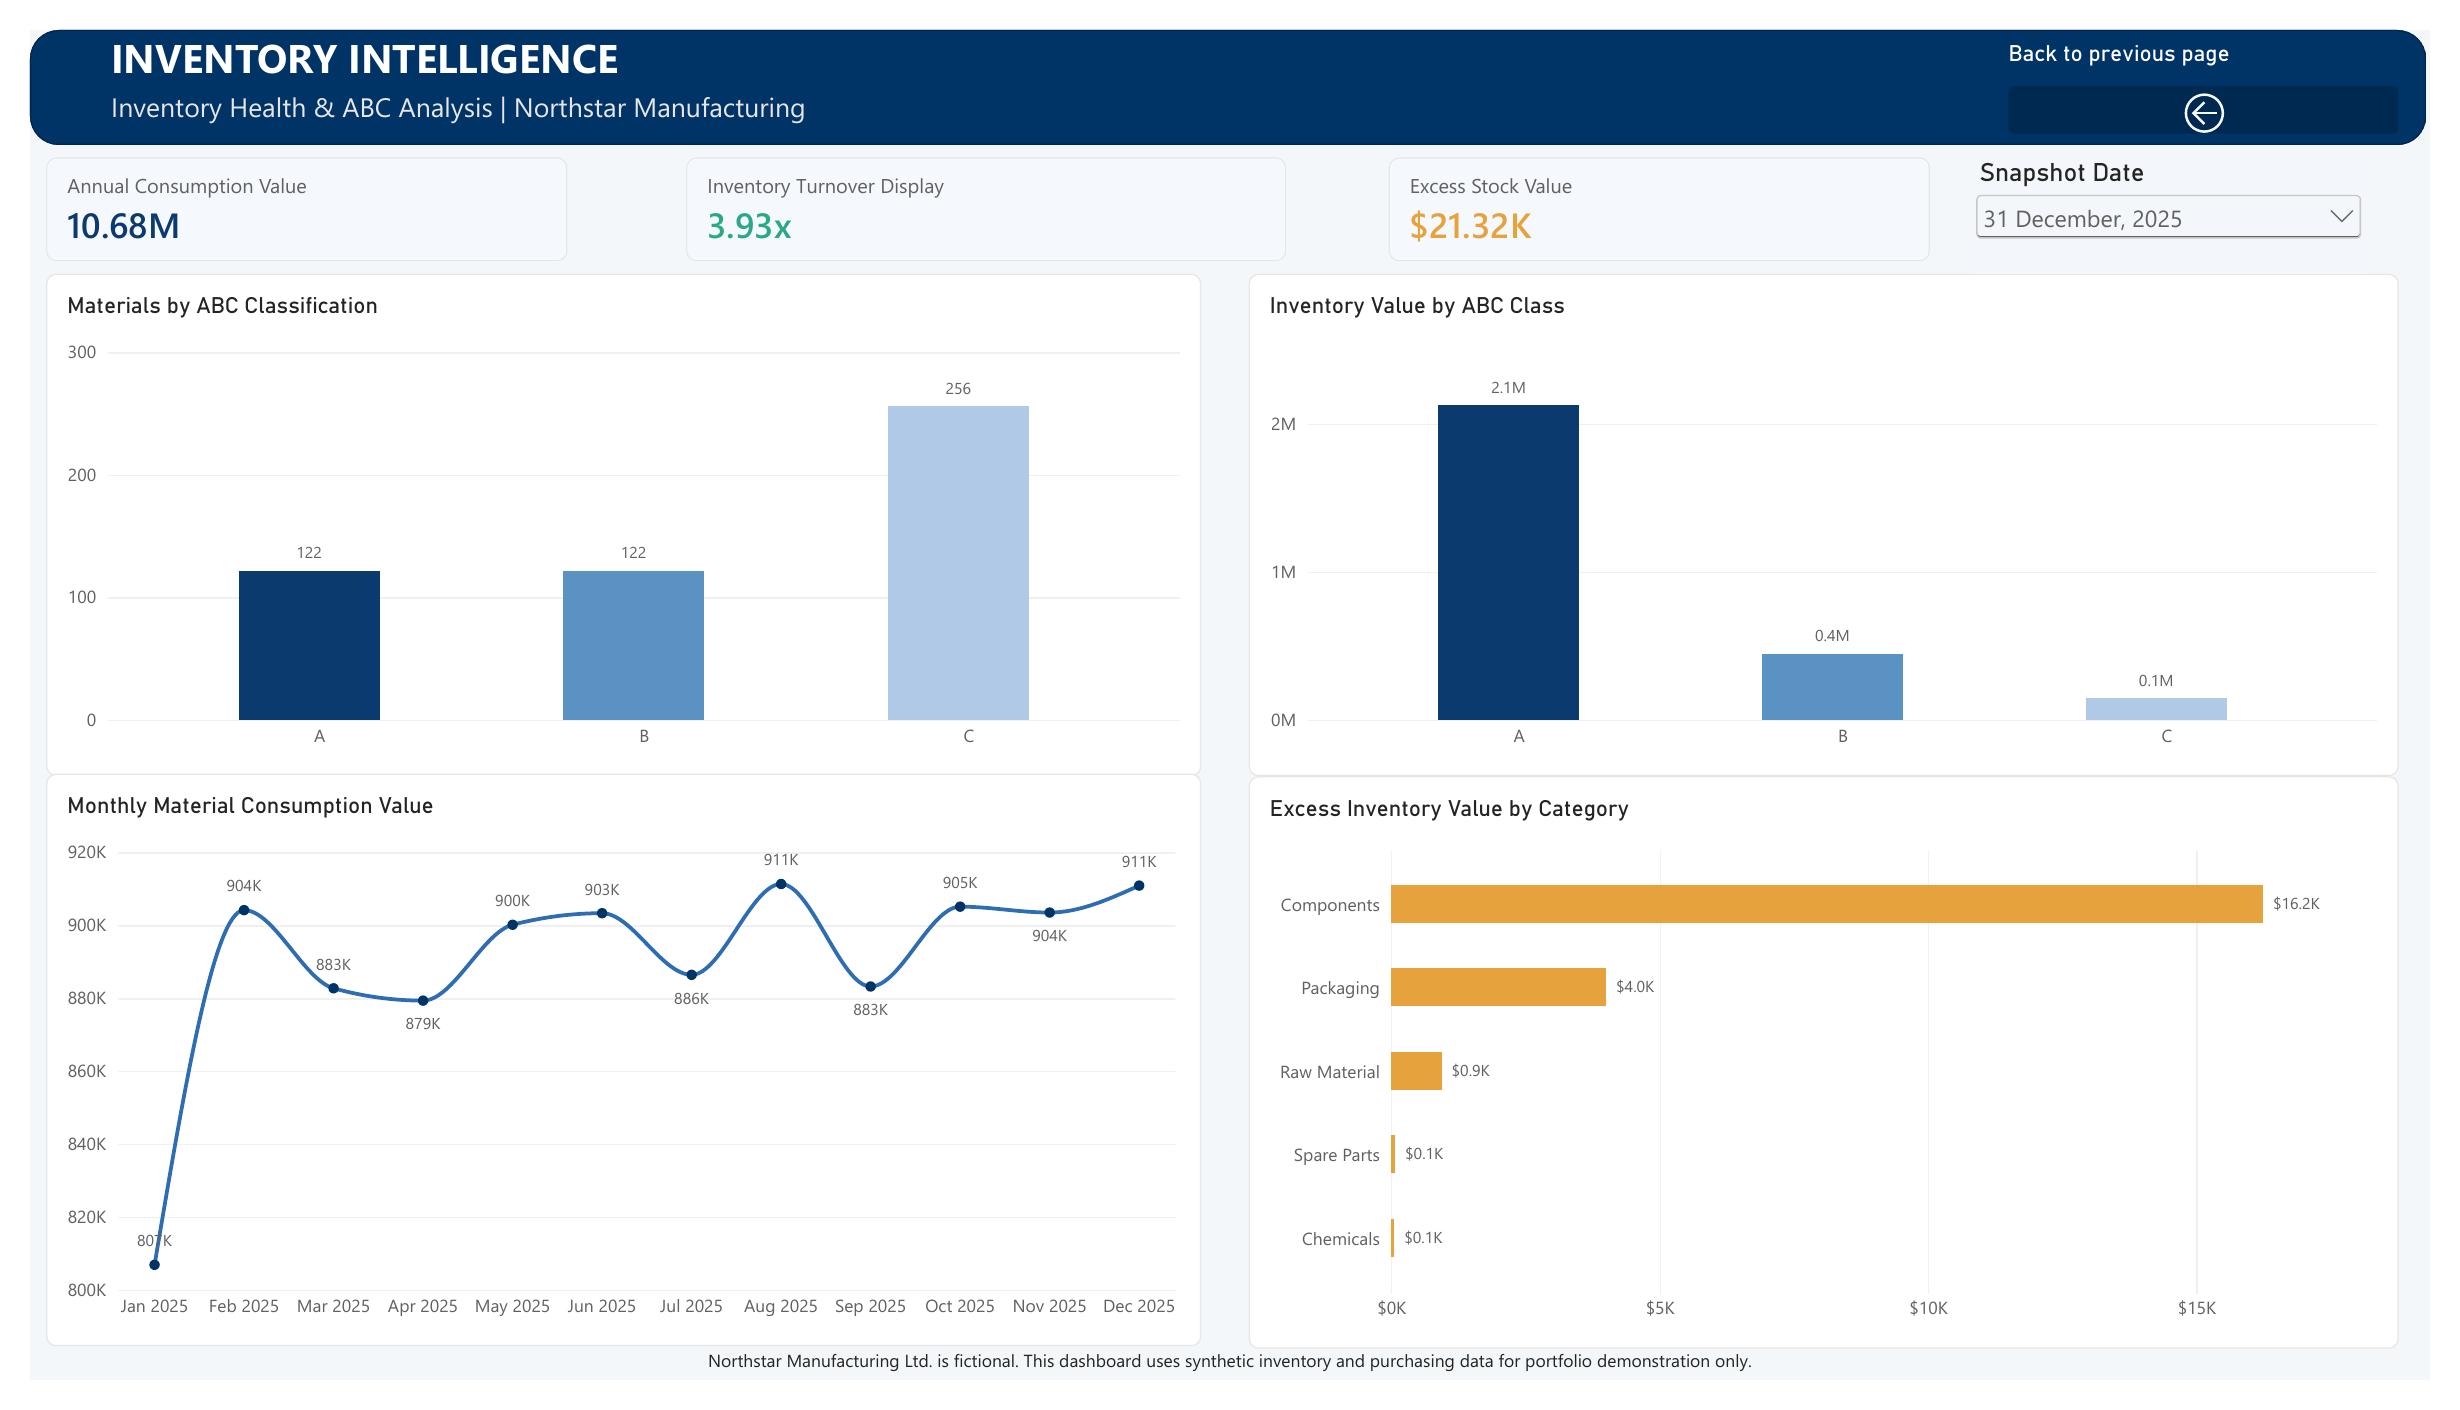
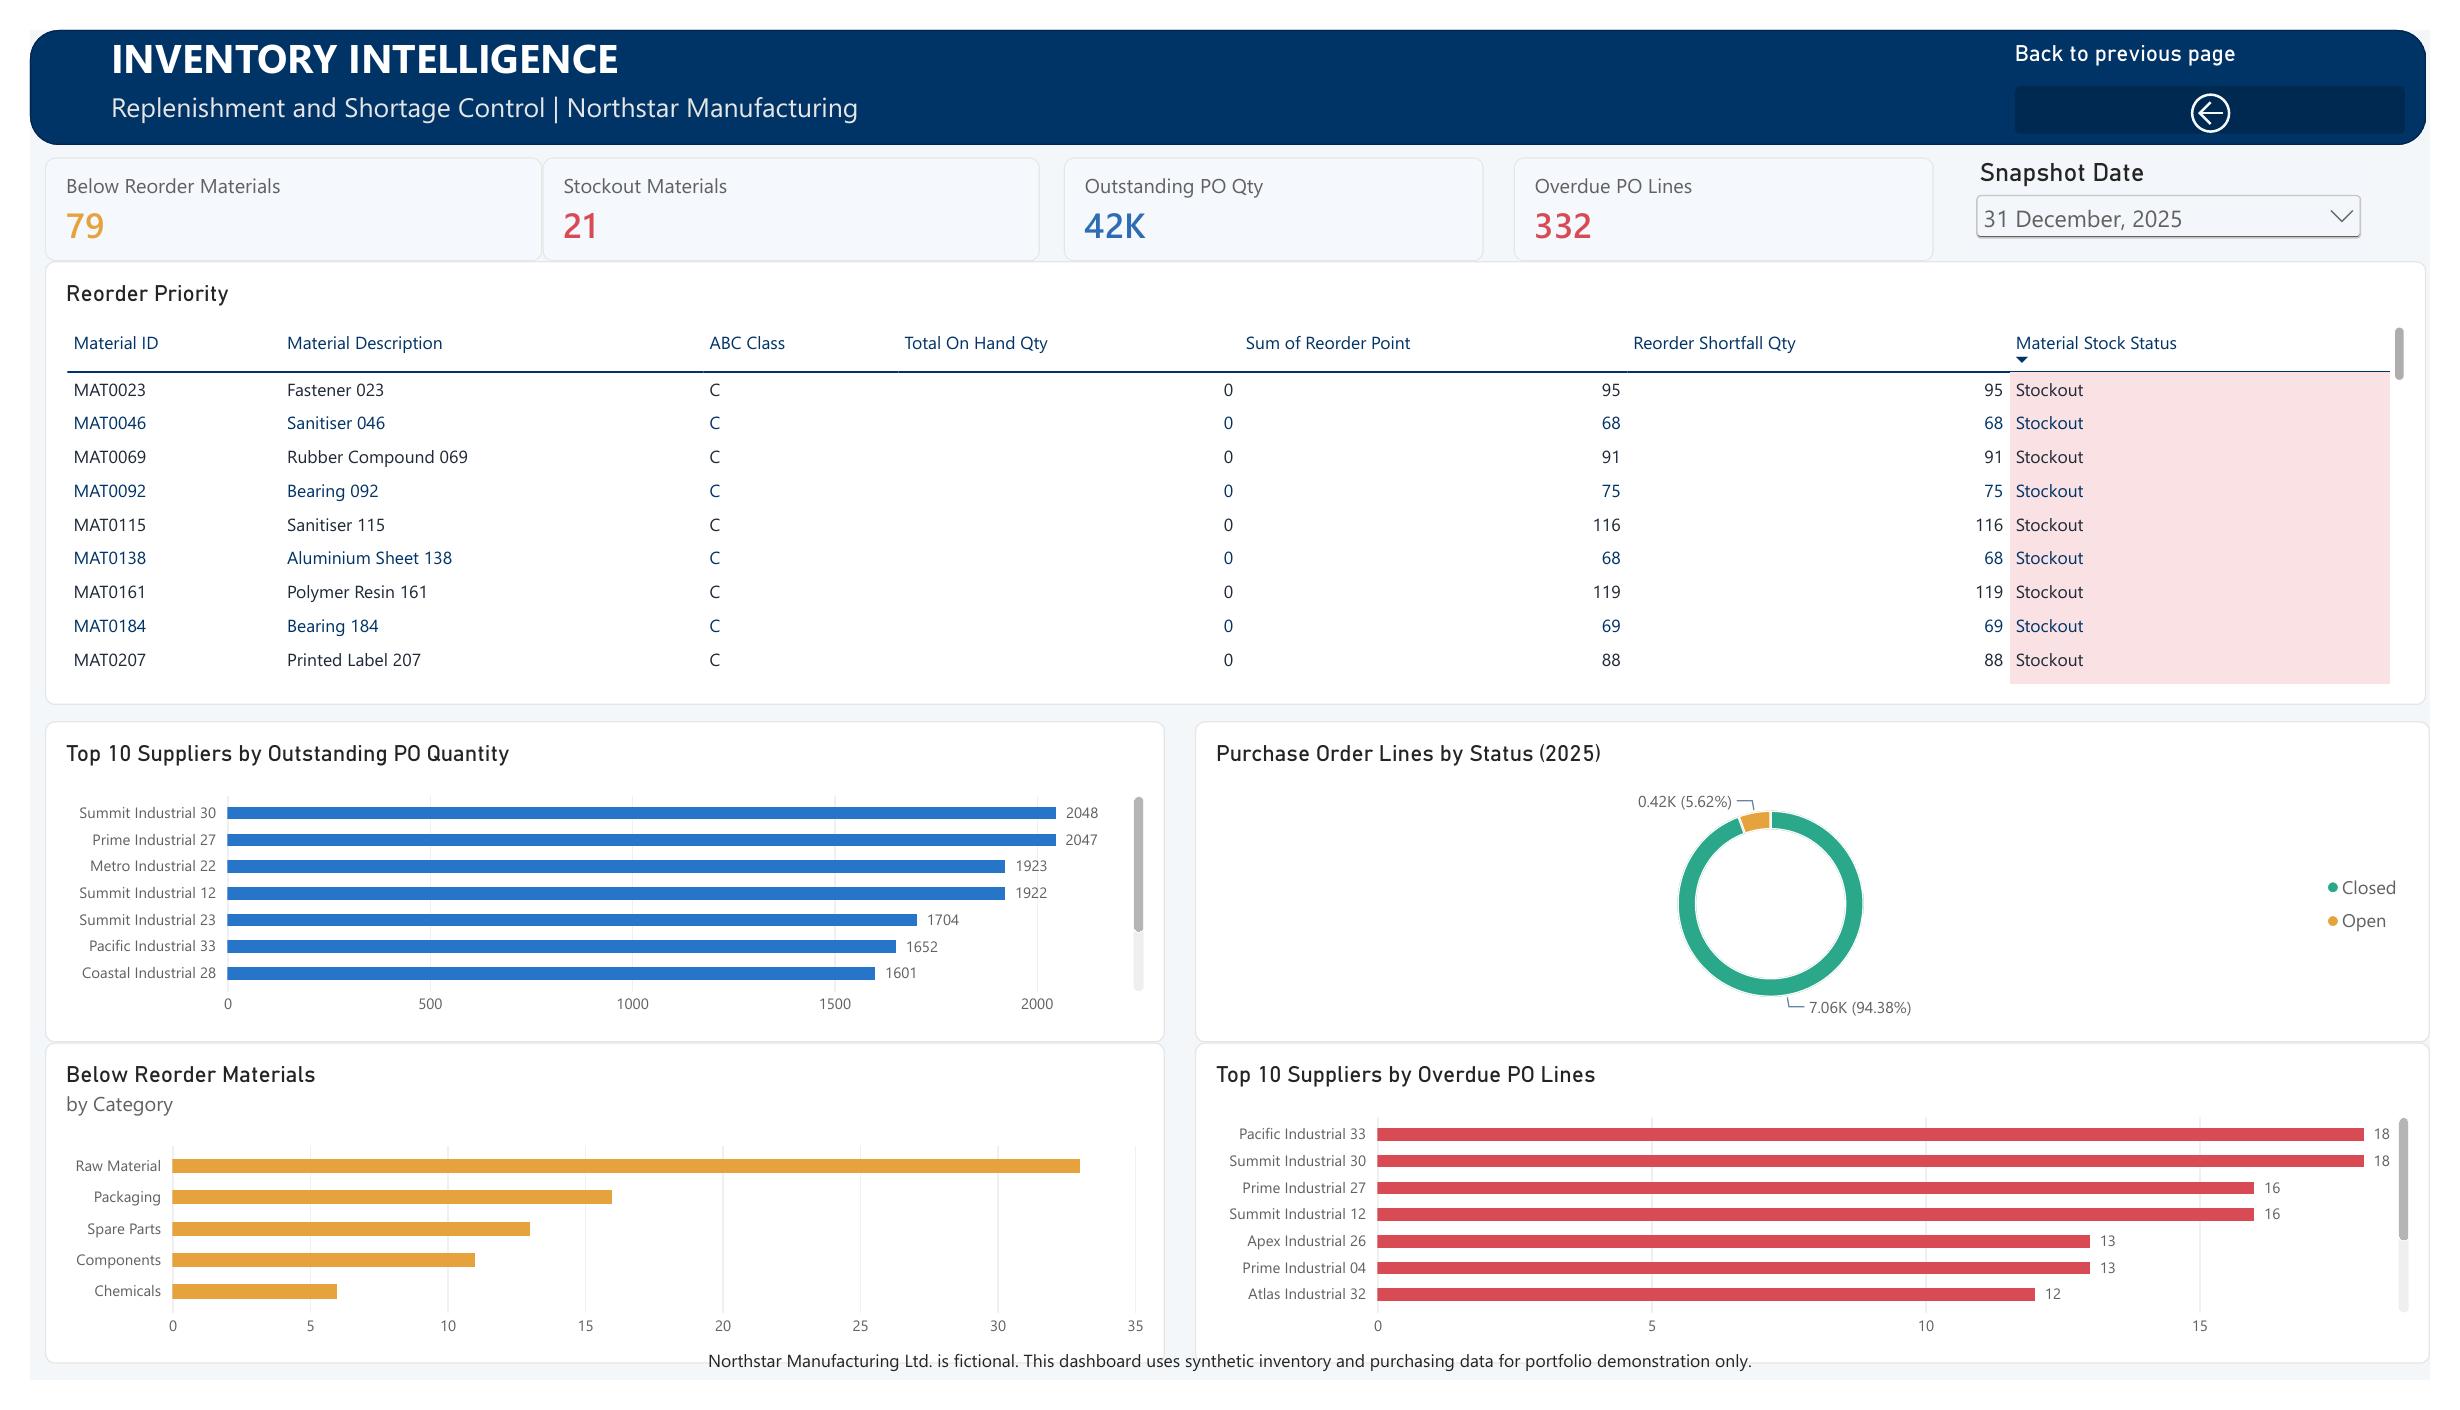
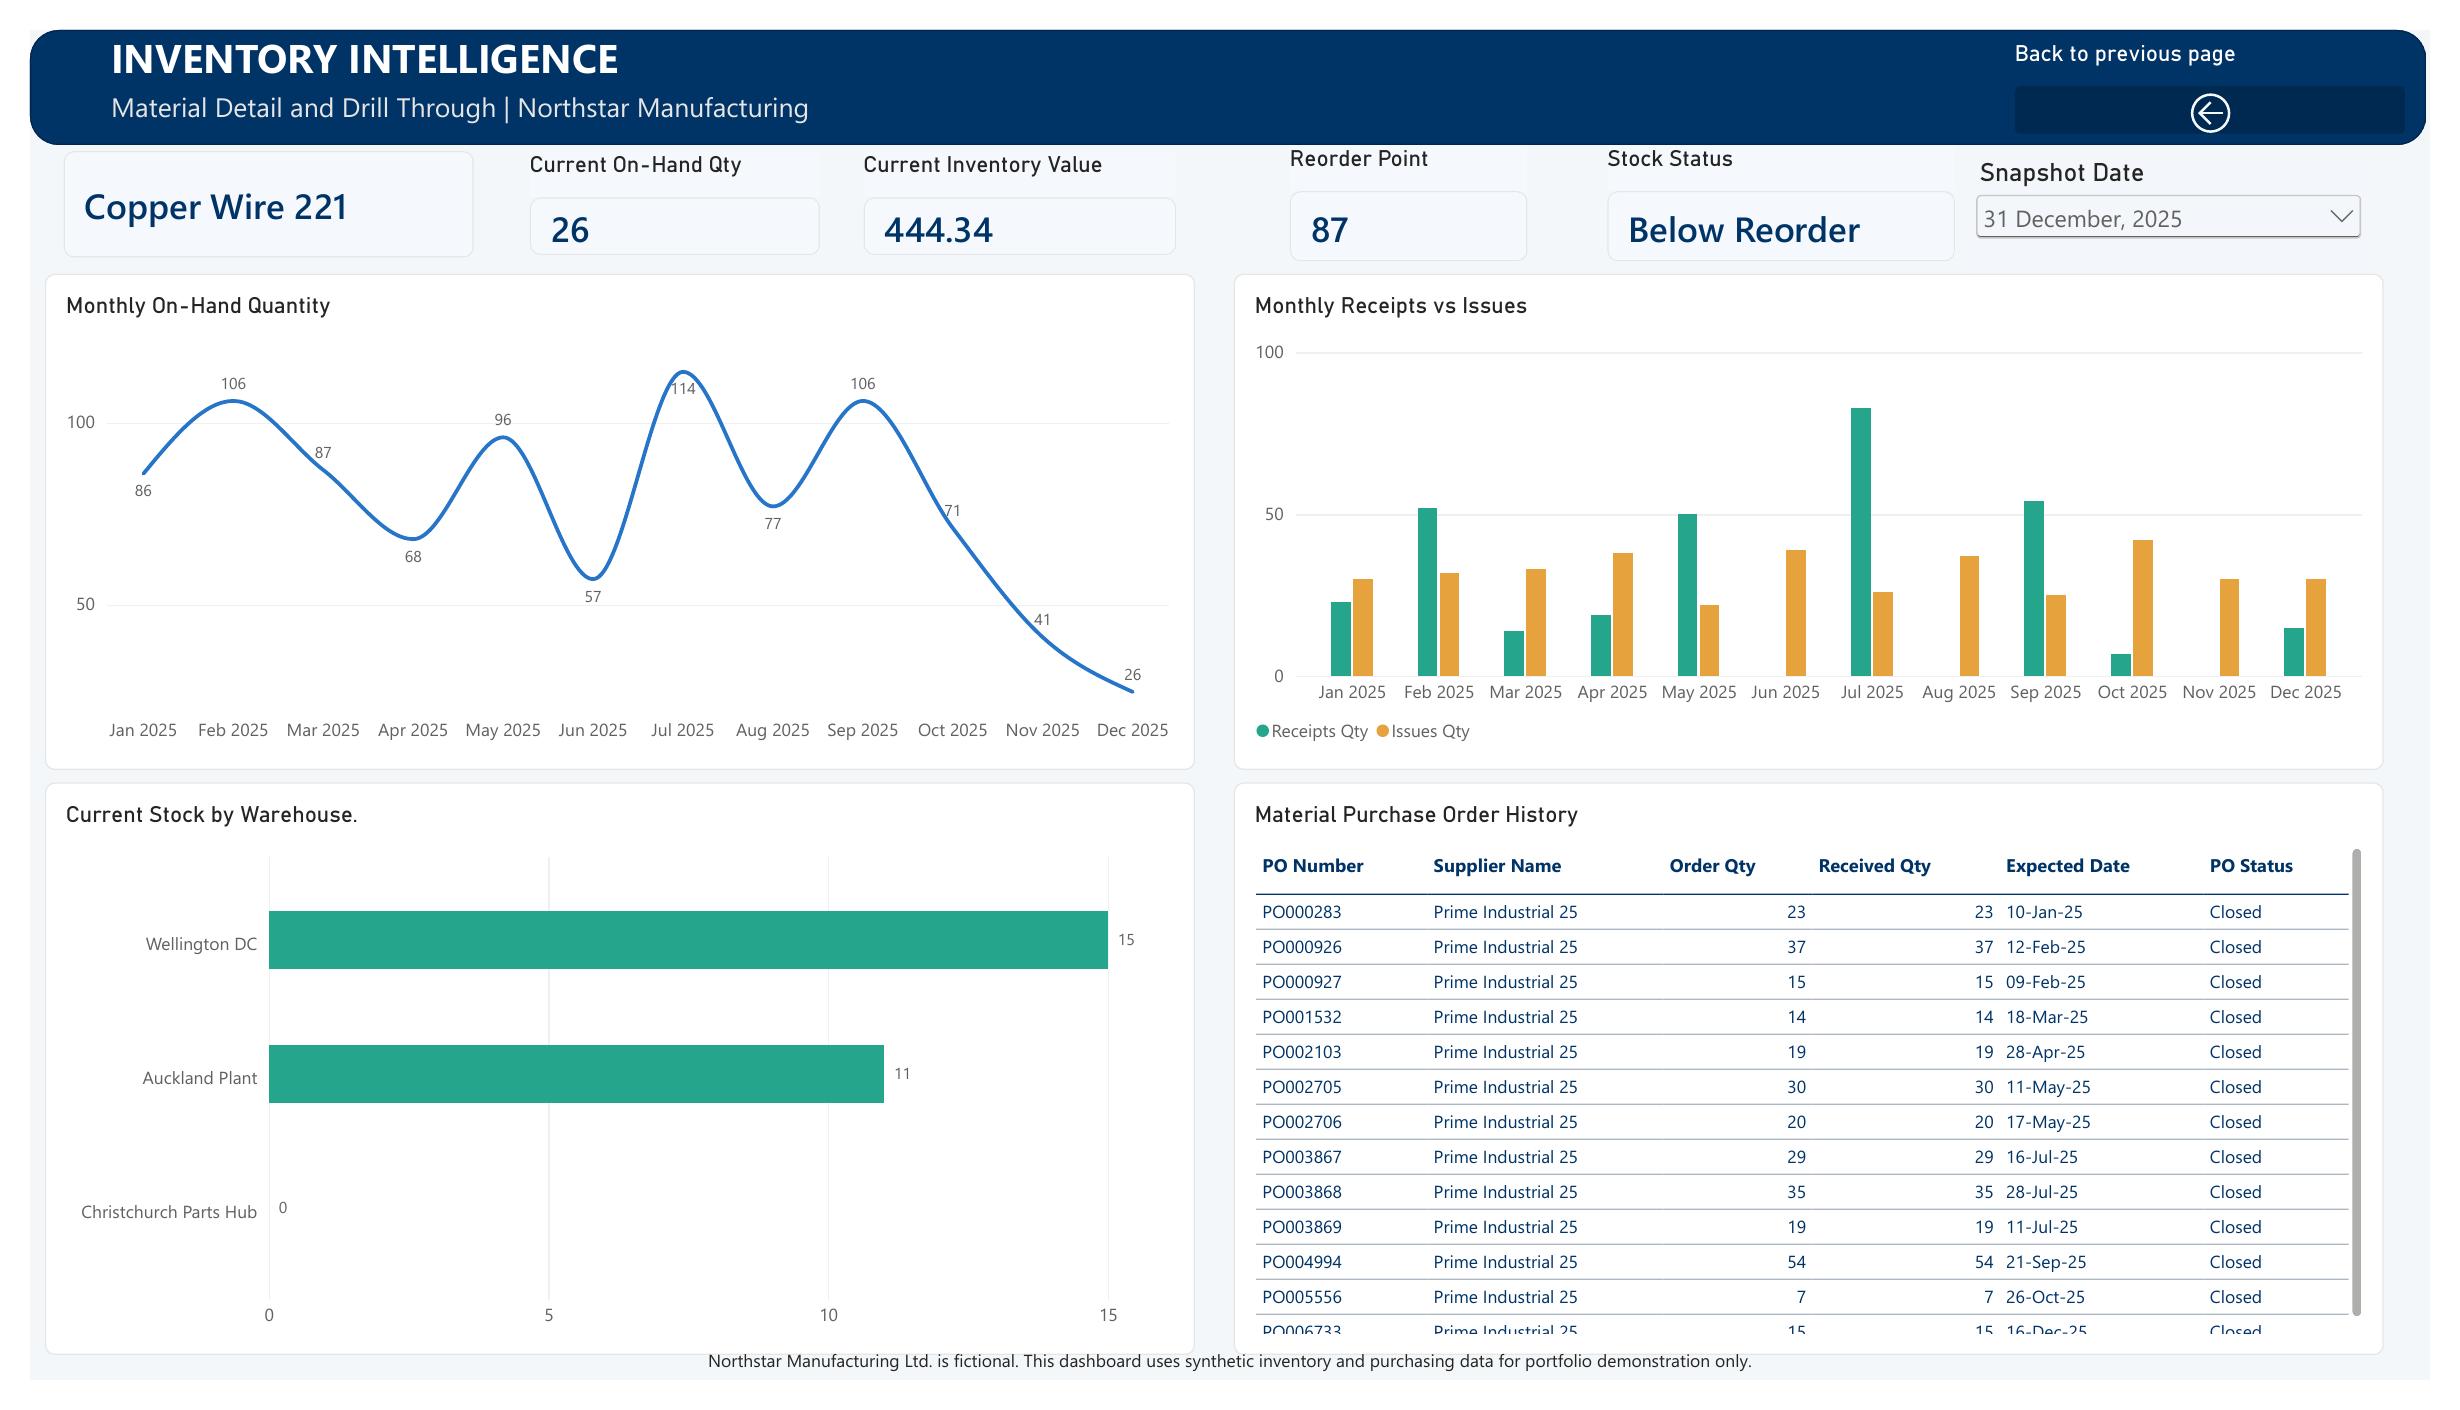
Four connected report pages: an Executive Overview of inventory value, shortages and warehouse exposure; an Inventory Health & ABC Analysis page for consumption and excess stock; a Replenishment & Shortage Control page with colour-coded exception ranking and supplier follow-up; and a Material Detail drill-through page linking high-level KPIs to monthly stock, receipt, issue and purchasing history. Slicers, conditional formatting and drill-through make the report interactive.
Key Findings
The dashboard reveals NZ$2.72M of inventory value across 500 materials, with 79 materials below reorder point and 21 in stockout. Annual consumption value is NZ$10.68M with 3.93x inventory turnover, and 332 purchase-order lines are overdue. Excess stock is concentrated in the Components category.
Business Recommendations
Investigate the 21 stockouts first, prioritise the remaining below-reorder materials by production criticality, and review component excess stock and overdue supplier commitments. These are observed outputs from a synthetic demonstration; in a real deployment, purchasing and annual KPIs would be independently reconciled before action.
Tools Used
Power BI Desktop for report design, Power Query for data preparation, DAX for measures and calculations, Excel as the data source, and star-schema data modelling for the analytical layer.
Disclaimer
This is a portfolio demonstration using synthetic data. Northstar Manufacturing Ltd. is a fictional company.